Remove 2016 Remove Blog Remove Visualization
article thumbnail

The Top 20 Data Visualization Books That Should Be On Your Bookshelf

Data Pine

Now that you’re sold on the power of data analytics in addition to data-driven BI, it’s time to take your journey a step further by exploring how to effectively communicate vital metrics and insights in a concise, inspiring, and accessible format through the power of visualization. That’s a colossal number of books on visualization.

article thumbnail

13 Essential Data Visualization Techniques, Concepts & Methods To Improve Your Business – Fast

Data Pine

“By visualizing information, we turn it into a landscape that you can explore with your eyes. 90% of the information transmitted to the brain is visual. Data visualization methods refer to the creation of graphical representations of information. That’s where data visualization comes in. A sort of information map.

Insiders

Sign Up for our Newsletter

This site is protected by reCAPTCHA and the Google Privacy Policy and Terms of Service apply.

article thumbnail

Challenges in replacing SSRS with Microsoft Power BI

BizAcuity

It helps in transforming enterprise data into rich visuals. Migrating SSRS 2012/2014/2016 to Power BI is fine. For simple SSRS reports, it is not hard to move the queries over to Power BI and then reproduce the same visuals (tables, charts, etc). It also offers a more visual and interactive UI for the reports.

article thumbnail

How to Spot Misleading Charts, a Checklist

Tableau

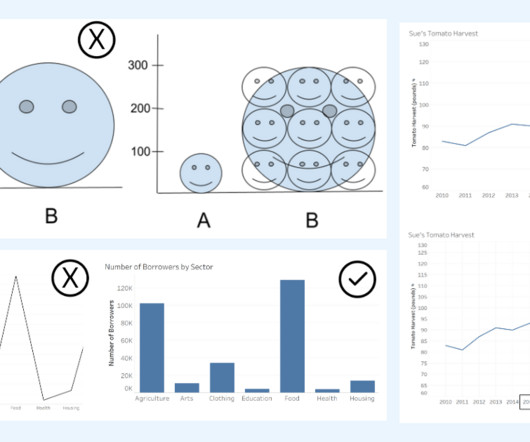
Alberto Cairo, data visualization expert and author of How Charts Lie Whether you are reading a social post, news article or business report, it’s important to know and evaluate the source of the data and charts that you view. The graph on the left is missing 2016, 2017 and 2018. Checklist, your guide to reviewing charts Source.

article thumbnail

How The Cloud Made ‘Data-Driven Culture’ Possible | Part 1

BizAcuity

And how this transformation will impact businesses in the short and long run is the main discussion in this blog. Microsoft also releases Power BI, a data visualization and business intelligence tool. 2016: Oracle launches with competencies across compute, storage, and networking. More on Kubernetes soon. To be continued.

IBM cost 130