This site uses cookies to improve your experience. To help us insure we adhere to various privacy regulations, please select your country/region of residence. If you do not select a country, we will assume you are from the United States. Select your Cookie Settings or view our Privacy Policy and Terms of Use.
Cookie Settings
Cookies and similar technologies are used on this website for proper function of the website, for tracking performance analytics and for marketing purposes. We and some of our third-party providers may use cookie data for various purposes. Please review the cookie settings below and choose your preference.
Used for the proper function of the website
Used for monitoring website traffic and interactions
Cookie Settings
Cookies and similar technologies are used on this website for proper function of the website, for tracking performance analytics and for marketing purposes. We and some of our third-party providers may use cookie data for various purposes. Please review the cookie settings below and choose your preference.
Strictly Necessary: Used for the proper function of the website
Performance/Analytics: Used for monitoring website traffic and interactions
Previously, we discussed the top 19 bigdata books you need to read, followed by our rundown of the world’s top business intelligence books as well as our list of the best SQL books for beginners and intermediates. Datavisualization, or ‘data viz’ as it’s commonly known, is the graphic presentation of data.
Digital data not only provides astute insights into critical elements of your business but if presented in an inspiring, digestible, and logical format, it can tell a tale that everyone within the organization can get behind. Datavisualization methods refer to the creation of graphical representations of information.
2007: Amazon launches SimpleDB, a non-relational (NoSQL) database that allows businesses to cheaply process vast amounts of data with minimal effort. An efficient bigdata management and storage solution that AWS quickly took advantage of. They now have a disruptive data management solution to offer to its client base.
Hal R.Varian stated, “The ability to take data—to be able to understand it, to process it, to extract value from it, to visualize it, to communicate it—that’s going to be a hugely important skill in the next decades.” Fast forward to 2016 and many businesses would agree with Varian’s astute assessment.
Over the last year, BigData has become increasingly more important for companies of all sizes. As data has become readily available, it has created an environment of opportunity but also uncertainty, as businesses compete with greater demands for information from customers and employees alike.
Some more examples of AI applications can be found in various domains: in 2020 we will experience more AI in combination with bigdata in healthcare. For example, in October 2016 Wells Fargo and The Commonwealth Bank of Australia made history by using blockchain to facilitate paying for a shipment of cotton from the U.S.
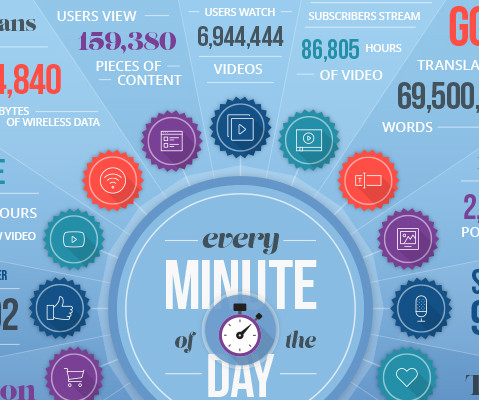
These mobile connections alone generate more than 18 million megabytes of data every minute — and that’s just in the U.S. At Domopalooza 2016, General Stanley McChrystal said, “Data is exploding faster than our ability to put our arms around it, so you’re going to have to adapt.
Attendees at Domopalooza 2016 got to hear it straight from the source. . “The colors, the aspect of it, the ease of manipulating it… If I could sum it up in one word, it would be: magical.” ” Interested in hearing more about how Domo took Stance from 99 problems to none?
The saying “knowledge is power” has never been more relevant, thanks to the widespread commercial use of bigdata and data analytics. The rate at which data is generated has increased exponentially in recent years. Essential BigData And Data Analytics Insights. million searches per day and 1.2
Analysis Paralysis When people think of data impeding progress, they often think of paralysis by analysis. The more people who can participate in this data journey and remain on the path, the better it will be for your company’s long-term success with data. Part 2) first appeared on Blog.
I’ve seen various vendors tout the power of natural language generation (NLG) as a means of providing automated data storytelling. Rather than relying on “confusing” datavisualizations, they feel descriptive text about the data is somehow better and easier for people to follow.
With the COVID-19 pandemic, the general public was forced to consume scientific information in the form of datavisualizations to stay informed about the current developments of the virus. Here they speak about two use-cases in which COVID-19 data was used in a misleading way. 4) Misleading datavisualization.
With widely used versions like Crystal Reports 2016 and its server editions anticipating losing support on December 31, 2027, and Crystal Reports 2020 scheduled to end support by 2026, you’re left with limited time to determine how to move forward without disruptions to your business intelligence workflows.
We organize all of the trending information in your field so you don't have to. Join 57,000+ users and stay up to date on the latest articles your peers are reading.
You know about us, now we want to get to know you!
Let's personalize your content
Let's get even more personalized
We recognize your account from another site in our network, please click 'Send Email' below to continue with verifying your account and setting a password.


Let's personalize your content