Remove 2015 Remove 2022 Remove Data Visualization
article thumbnail

How The Cloud Made ‘Data-Driven Culture’ Possible | Part 1

BizAcuity

The cloud market is well on track to reach the expected $495 billion dollar mark by the end of 2022. In 2022, Amazon is still the single largest leader in the cloud market with over 30% market share. Microsoft also releases Power BI, a data visualization and business intelligence tool. Google launches Google Drive.

IBM cost 130
article thumbnail

Take Your SQL Skills To The Next Level With These Popular SQL Books

Data Pine

Business leaders, developers, data heads, and tech enthusiasts – it’s time to make some room on your business intelligence bookshelf because once again, datapine has new books for you to add. We have already given you our top data visualization books , top business intelligence books , and best data analytics books.

IBM cost 117
Insiders

Sign Up for our Newsletter

This site is protected by reCAPTCHA and the Google Privacy Policy and Terms of Service apply.

article thumbnail

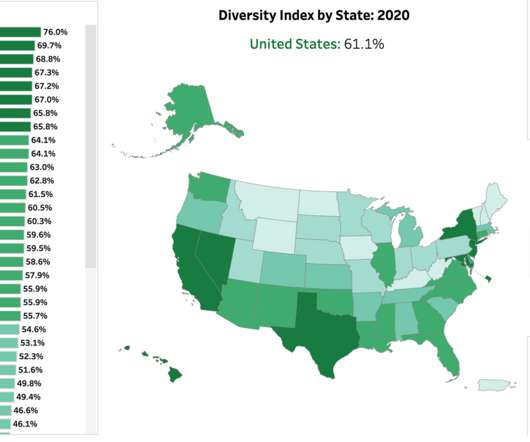
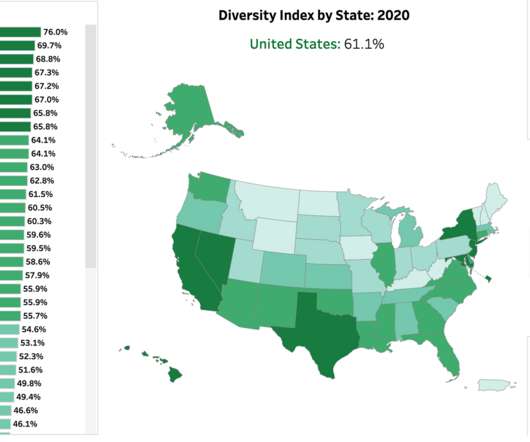
U.S. Census data reveals growing racial and ethnic diversity

Tableau

January 12, 2022 - 10:53pm. January 13, 2022. We recently connected with three data experts at the U.S. Census Bureau who are using Tableau to visualize race and ethnicity data from the 2020 Decennial Census. The answer: data visualizations. A closer look at the new dashboards. DI in 2010.