Remove 2014 Remove Events Remove Visualization
article thumbnail

Exploratory Data Analysis using Data Visualization Techniques!

The BAWorld

We can define exploratory data analysis as the essential data investigation process before the formal analysis to spot patterns and anomalies, discover trends, and test hypotheses with summary statistics and visualizations. Visualization helps to infer insights easily from massive datasets. They are helpful for recognizing trends.

article thumbnail

Exploratory Data Analysis using Data Visualization Techniques!

The BAWorld

We can define exploratory data analysis as the essential data investigation process before the formal analysis to spot patterns and anomalies, discover trends, and test hypotheses with summary statistics and visualizations. Visualization helps to infer insights easily from massive datasets. Types of Exploratory Data Analysis.

Insiders

Sign Up for our Newsletter

This site is protected by reCAPTCHA and the Google Privacy Policy and Terms of Service apply.

article thumbnail

Euro Soccer Special: What Football Teaches Us About Analytics

Sisense

Heat map data visualizations have shown teams that keep possession of the ball and maintain high intensity are most likely to score goals and win games. On 8 July 2014, Brazil suffered its worst ever defeat at the hands of Germany, losing 7-1 in the World Cup semifinal. Example of Sisense player performance dashboard.

article thumbnail

Using the Product Canvas to Define Your Product: Getting Started

EBG Consulting

The BMG canvas inspired me in 2014 to create the first version of a Product Canvas when I was product coach as a global car-sharing company. You can represent the vision in a variety of ways including as a tagline, meme, a product differentiation statement [3], a visual image, or a storyline. Is there a visual image? References.

Vision 75
article thumbnail

Guide to Business Process Model and Notation (BPMN) Certification

The BAWorld

BPMN is the visual language that bridges the gap between stakeholders’ requirements and the workflow which includes actions, events, activities, artifacts, and connections between the objects. It uses symbols and notations to create visual models for business processes BPMN 2.0 The BPMN 2.0

article thumbnail

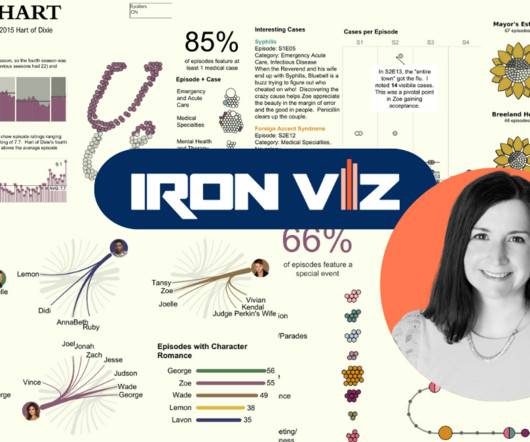
Meet Iron Viz 2024 Finalist Jessica Moon

Tableau

Hunting for a job in contracts after giving birth to her first child, an opportunity arose to test data visualizations produced by a team using Tableau. By 2014, Jessica was a full-time Tableau viz tester. “As I particularly enjoy B2VB–Back to Viz Basics –because they focus on just one element of visualization.

article thumbnail

Goodbye Oracle Discoverer, Hello Next-Generation Reporting

Insight Software

Oracle’s 2014 Statement of Direction laid out its support strategy. Interactive dashboards that provide reports with a rich variety of visualization tools. Exception reporting – Detection and alerts that trigger workflows based on business events. Note that extended support for Oracle Discoverer ended in 2017.