Remove 2014 Remove Data Visualization Remove Visualization
article thumbnail

Celebrating Women in Data Visualization

Juice Analytics

March is Women’s History Month and as a company that celebrates women, we wanted to highlight some of the most influential women in the history of data visualization! Florence Nightingale: Florence Nightingale is considered to be one of the first pioneers of data visualization. Lea Pica eapica.com/about-lea-pica/.

article thumbnail

Exploratory Data Analysis using Data Visualization Techniques!

The BAWorld

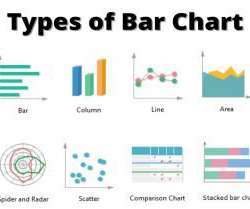
We can define exploratory data analysis as the essential data investigation process before the formal analysis to spot patterns and anomalies, discover trends, and test hypotheses with summary statistics and visualizations. It gives an idea about the data we will be digging deep into while analyzing. Bar charts.

Insiders

Sign Up for our Newsletter

This site is protected by reCAPTCHA and the Google Privacy Policy and Terms of Service apply.

article thumbnail

Exploratory Data Analysis using Data Visualization Techniques!

The BAWorld

We can define exploratory data analysis as the essential data investigation process before the formal analysis to spot patterns and anomalies, discover trends, and test hypotheses with summary statistics and visualizations. It gives an idea about the data we will be digging deep into while analyzing. Bar charts.

article thumbnail

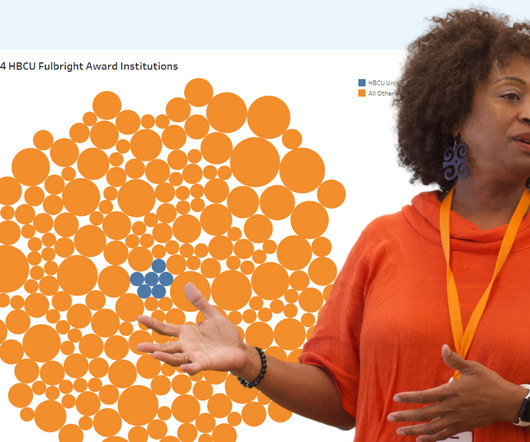
Fulbright Award Winner Closes Data Skills Gap for Students and Teachers

Tableau

Danika Harrod October 22, 2024 - 5:46pm Larissa Amoroso Vice President, Tableau Community, Tableau Tableau Academic Ambassador Dr. Mary Dunaway has spent years empowering students and educators with skills such as data visualization. There’s so much to know about Tableau and data analytics that you can’t cover everything in one course.

article thumbnail

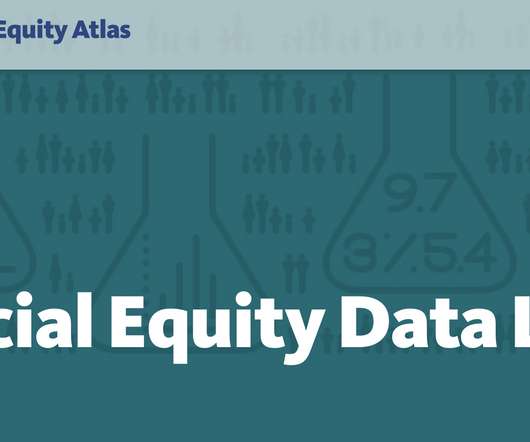
Introducing PolicyLink’s Racial Equity Data Lab: A new resource to support data for justice

Tableau

Our partners at PolicyLink launched their National Equity Atlas in 2014. Developed with USC’s Equity Research Institute , the Atlas is one of the most powerful resources for data on racial inequities in the country. The Lab is designed as a comprehensive data visualization resource for organizers working for racial equity and justice.

article thumbnail

Best of Tableau Web: July 2022

Tableau

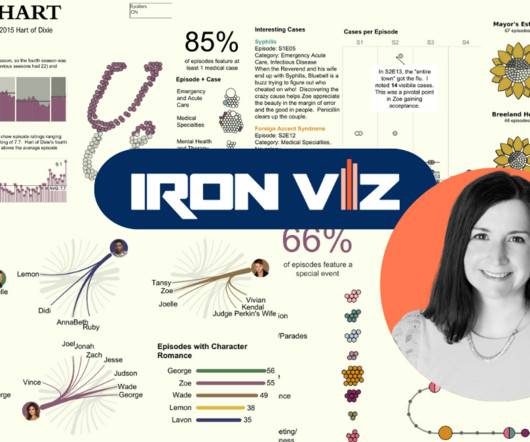
Similar to the advancements in telescope technology, data visualizations 10 years ago were no where near the art they’ve become today. Vizzes advance as the industry learns more about accessibility and human cognition, and as improved data literacy pushes the world to be more data driven. Go TEAM DATA!