Remove 2014 Remove Data Visualization Remove Information
article thumbnail

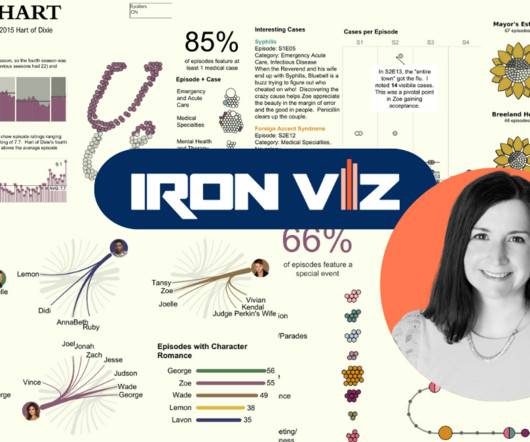
Celebrating Women in Data Visualization

Juice Analytics

March is Women’s History Month and as a company that celebrates women, we wanted to highlight some of the most influential women in the history of data visualization! Florence Nightingale: Florence Nightingale is considered to be one of the first pioneers of data visualization. Lea Pica eapica.com/about-lea-pica/.


article thumbnail

5 Ingenious Tips For A Promising Big Data Career

Smart Data Collective

Big data has been billed as being the future of business for quite some time. Analysts have found that the market for big data jobs increased 23% between 2014 and 2019. The impact of big data is felt across all sectors of the economy. However, the future is now. The market for Hadoop jobs increased 58% in that timeframe.

Big Data 203
Insiders

Sign Up for our Newsletter

This site is protected by reCAPTCHA and the Google Privacy Policy and Terms of Service apply.

article thumbnail

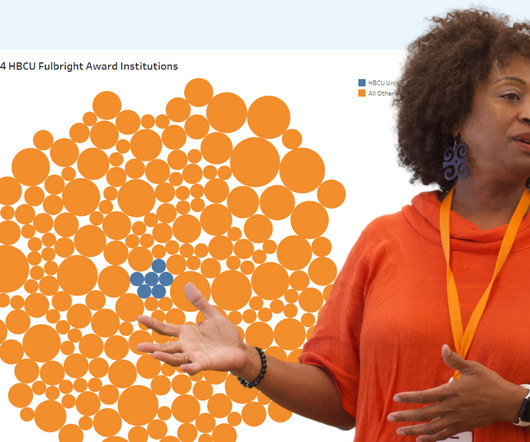
Fulbright Award Winner Closes Data Skills Gap for Students and Teachers

Tableau

Danika Harrod October 22, 2024 - 5:46pm Larissa Amoroso Vice President, Tableau Community, Tableau Tableau Academic Ambassador Dr. Mary Dunaway has spent years empowering students and educators with skills such as data visualization. There’s so much to know about Tableau and data analytics that you can’t cover everything in one course.

article thumbnail

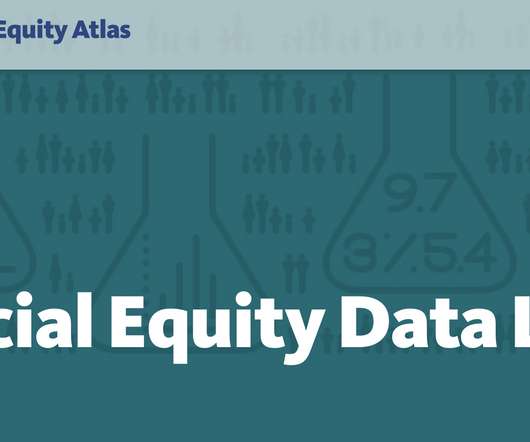
Introducing PolicyLink’s Racial Equity Data Lab: A new resource to support data for justice

Tableau

Our partners at PolicyLink launched their National Equity Atlas in 2014. Developed with USC’s Equity Research Institute , the Atlas is one of the most powerful resources for data on racial inequities in the country. Local leaders and advocates across the country rely on the access to inform their campaigns and policy efforts. .

article thumbnail

Twitter Round-Up: Mar 6 – 13

Domo

Why data visualization is the future [link] — Forbes (@Forbes) March 11, 2014 According to Forbes, big data isn’t the future—data visualization is. But it comes with a caveat: data visualization depends on data (after all, what else are you supposed to visualize?),

Retail 52
article thumbnail

14 Best Data Storytelling Tools 2021

Juice Analytics

Data storytelling is quickly becoming a popular mode for presenting data. It combines text and graphics with data visualizations to guide an audience. But these solutions are limited in their ability to balance the explanatory and exploratory elements of an effective data story. Cost : Free plan (up to 3 users).

article thumbnail

Bad BI habits, how to fix “crappy” visualizations, and big data vs. retail: Twitter Round-Up for June 6

Domo

HubSpot says of data visualization, “It’s about presenting information in a way that is easy to understand and intuitive to navigate, making the viewer do as little legwork as possible. Of course, not all designers are data visualization experts, which is why much of the visual content we see is, well, less than stellar.