Remove 2011 Remove Reference Remove Visualization
article thumbnail

Transforming Ideas into Features: Tableau's Commitment to Community-Driven Innovation

Tableau

We had this in mind when in 2011, Tableau created the Ideas section of the Forums to help you share Tableau product features you’d like to see created. Since 2011, more than 11,000 ideas from almost 4,000 community members have been shared on the Forums, including more than 430 new ideas in 2023 alone.

article thumbnail

Guide to Business Process Model and Notation (BPMN) Certification

The BAWorld

BPMN is the visual language that bridges the gap between stakeholders’ requirements and the workflow which includes actions, events, activities, artifacts, and connections between the objects. specification, which introduced the latest set of symbols and notations, was released in 2011. The BPMN 2.0

Insiders

Sign Up for our Newsletter

This site is protected by reCAPTCHA and the Google Privacy Policy and Terms of Service apply.

article thumbnail

Benefits of Scaled Agile Framework ( SAFe®) – Agilemania

Agilemania

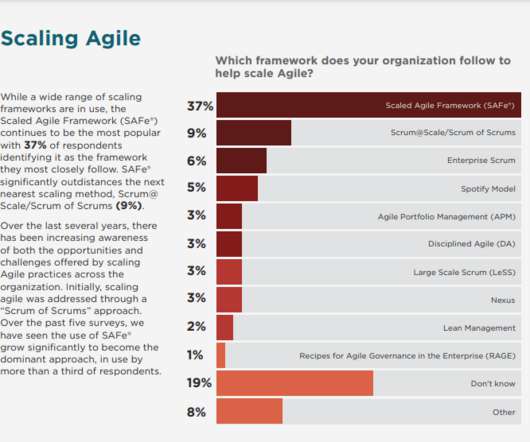
The year was 2011 and there was a pressing need for a scaling framework that could help large organizations design efficient systems to build enterprise level products/solutions to cater to customer’s rapidly changing needs. Visualize and limit WIP, reduce batch sizes, and manage queue lengths. Apply Systems Thinking.

Agile 98
article thumbnail

This Month in Embedded Analytics: June

Sisense

Data is truly everywhere, and this month our eyes are drawn in several disparate directions, including beloved movies, the use of analytics in high-level strategic decisions, and even Florence Nightingale’s use of data visualizations to save lives in the Crimean War. Florence Nightingale’s data visualizations evolved medicine and saved lives.

article thumbnail

Investing in the Right Skills to Lead Your Organization to Success, Are Power Skills the New Soft Skills?

Cprime

Are visual thinking and creativity power skills? Visualization can assist with this through team collaboration, communication, problem solving, and idea generation. In the academic study What We See and Why It Matters, Anneliese Tillmann shares insights from multiple sources on the importance of visual literacy.

article thumbnail

The theory of constraints and how it can help efficiency

Monday

These changes are referred to as injections. Goldratt died in June 2011, and shortly afterward the Theory of Constraints Institute was founded to preserve his work and legacy. Our dashboard is filled with charts demonstrating productivity levels so you can easily visualize which aspects need to be worked on. Get started.

article thumbnail

An In-Depth Guide to Component-Based Architecture: Features, Benefits, and more

Marutitech

was released soon after in 2011, and the community later rallied behind it as the leader of this space. Design References: Try to include dos and don’ts, guidelines, and visual concerns of the components for better understanding. ReactJs was invented in 2013, becoming one of the most-loved frameworks.