Remove 2009 Remove Presentation Remove Visualization
article thumbnail

New Edition of “Now You See It”

Perceptual Edge

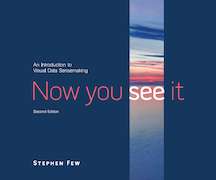
On April 15, 2021, my book Now You See It (2009) will become available in its second edition with the revised subtitle An Introduction to Visual Data Sensemaking. Now You See It: An Introduction to Visual Data Sensemaking. Before you can present information to others, you must first make sense of it.

article thumbnail

How to Spot Misleading Charts, a Checklist

Tableau

Alberto Cairo, data visualization expert and author of How Charts Lie Whether you are reading a social post, news article or business report, it’s important to know and evaluate the source of the data and charts that you view. Who made the presentation and who paid for the work to be done? Know the Source. How was the data collected?

Insiders

Sign Up for our Newsletter

This site is protected by reCAPTCHA and the Google Privacy Policy and Terms of Service apply.

article thumbnail

Data storytelling pt.1: The essential data science skills everyone needs

Domo

During a 2009 interview , Google’s Chief Economist Dr. Hal R.Varian stated, “The ability to take data—to be able to understand it, to process it, to extract value from it, to visualize it, to communicate it—that’s going to be a hugely important skill in the next decades.”

article thumbnail

How To Spot Misleading Charts: Review the Message

Tableau

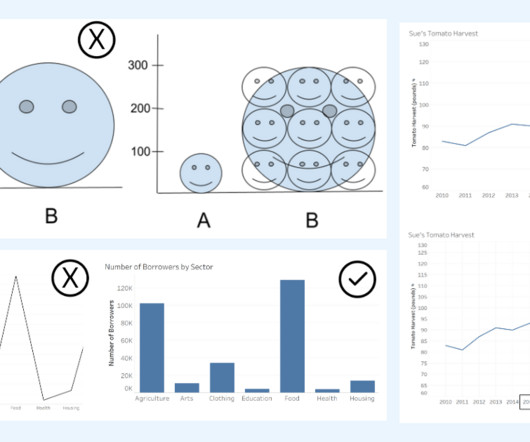
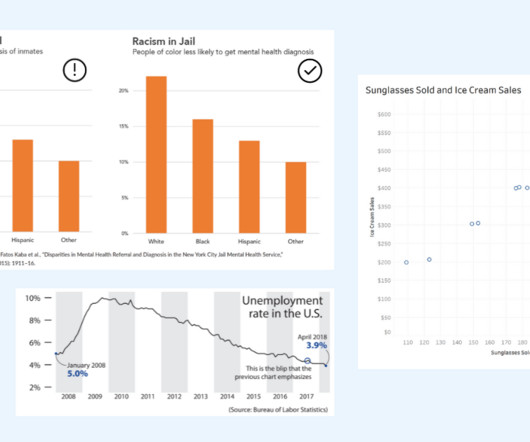
When viewing and creating charts, it’s vital that we discern the integrity of the information and conclusions presented in charts. Data Visualization expert and author Kathy Rowell says that we should always ask “Compared to What?” Ask if the entire context is being presented. Including this context tells a very different story.

article thumbnail

3 Business Takeaways From an MLS Team’s Success

Domo

RSL has been the most consistent winner in MLS since 2008—winners of the coveted MLS Cup in 2009 after only four seasons of existence. Anyone—from CEO to contributor—has the ability to discover, mash up, visualize and present data any way they’d like. How can Domo help?

article thumbnail

The Importance Of Financial Reporting And Analysis: Your Essential Guide

Data Pine

Trend identification: Regardless of what area of financial activity you’re looking to track, all types of this kind of reporting will help you identify trends, both past and present, which will empower you to tackle any potential weaknesses while helping you make the kind of improvements that will benefit the overall health of your business.

article thumbnail

Analyzing the history of Tableau innovation

Tableau

Click to view the full interactive visualization. I was a member of Chris’ dissertation committee, having done a Stanford PhD on automatic design of graphical presentations that Chris had used in his dissertation. VizQL: A domain-specific language for visual, self-service analysis. Release v1.0