Remove 2009 Remove Data Visualization Remove Document
article thumbnail

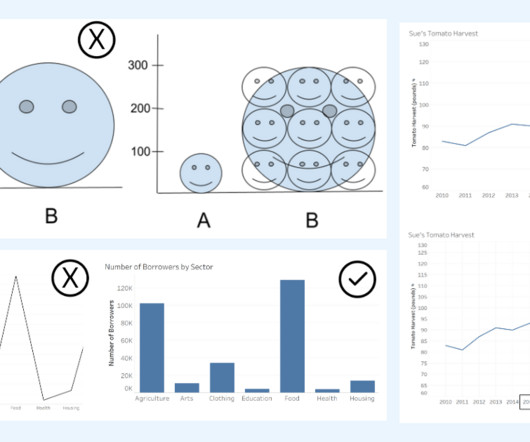
How to Spot Misleading Charts, a Checklist

Tableau

Alberto Cairo, data visualization expert and author of How Charts Lie Whether you are reading a social post, news article or business report, it’s important to know and evaluate the source of the data and charts that you view. To help you question the data, be sure to study the metadata, which is the data about the data.

article thumbnail

The Importance Of Financial Reporting And Analysis: Your Essential Guide

Data Pine

firm Kraft, in 2009, it reported IFRS-based profits of $690 million. The government’s requirements for these documents has created an entire industry of auditing firms (like the “Big 4” of KPMG, Ernst & Young, Deloitte, and PWC) that exist to independently review companies’ financial reports.

Insiders

Sign Up for our Newsletter

This site is protected by reCAPTCHA and the Google Privacy Policy and Terms of Service apply.

article thumbnail

Analyzing the history of Tableau innovation

Tableau

This allows you to explore features spanning more than 40 Tableau releases, including links to release documentation. . A diamond mark can be selected to list the features in that release, and selecting a colored square in the feature list will open release documentation in your browser. The Salesforce purchase in 2019.