Remove 2009 Remove Blog Remove Data Visualization
article thumbnail

Smarten Augmented Analytics Receives CERT-IN Certification for Its Products and Services!

ElegantJ BI

The Information Technology Amendment Act of 2009 designated CERT-IN as the national agency to perform functions for cyber security, including the collection, analysis and dissemination of information on cyber incidents, as well as taking emergency measures to handle incidents and coordinating cyber incident response activities.

Insiders

Sign Up for our Newsletter

This site is protected by reCAPTCHA and the Google Privacy Policy and Terms of Service apply.

article thumbnail

Smarten Augmented Analytics Receives CERT-IN Certification for Its Products and Services!

ElegantJ BI

The Information Technology Amendment Act of 2009 designated CERT-IN as the national agency to perform functions for cyber security, including the collection, analysis and dissemination of information on cyber incidents, as well as taking emergency measures to handle incidents and coordinating cyber incident response activities.

article thumbnail

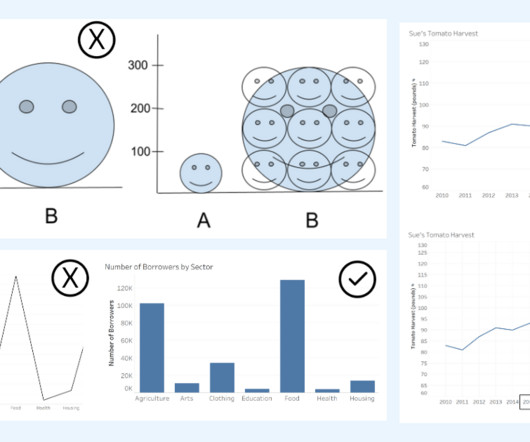
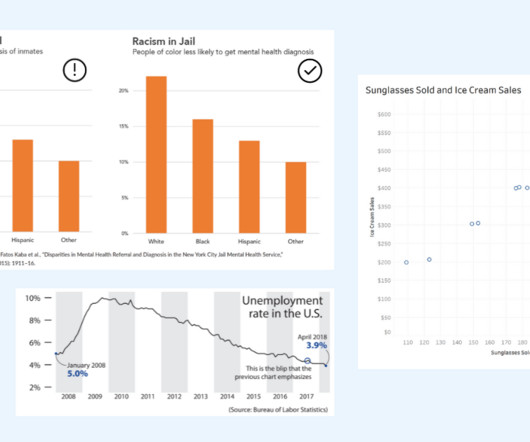
How to Spot Misleading Charts, a Checklist

Tableau

Alberto Cairo, data visualization expert and author of How Charts Lie Whether you are reading a social post, news article or business report, it’s important to know and evaluate the source of the data and charts that you view. Data Visualization expert and author Kathy Rowell says that we should always ask “Compared to What?”,

article thumbnail

How The Cloud Made ‘Data-Driven Culture’ Possible | Part 1

BizAcuity

And how this transformation will impact businesses in the short and long run is the main discussion in this blog. 2009: Amazon releases its own Relational Database Services on cloud to simplify set up and operations. Microsoft also releases Power BI, a data visualization and business intelligence tool. To be continued.

IBM cost 130
article thumbnail

Data storytelling pt.1: The essential data science skills everyone needs

Domo

Your data may hold tremendous amounts of potential value , but not an ounce of value can be created unless insights are uncovered and translated into actions or business outcomes. Data visualization expert Stephen Few said, “Numbers have an important story to tell. The post Data storytelling pt.1:

article thumbnail

What is Area Chart – A Complete Guide for Beginners

The BAWorld

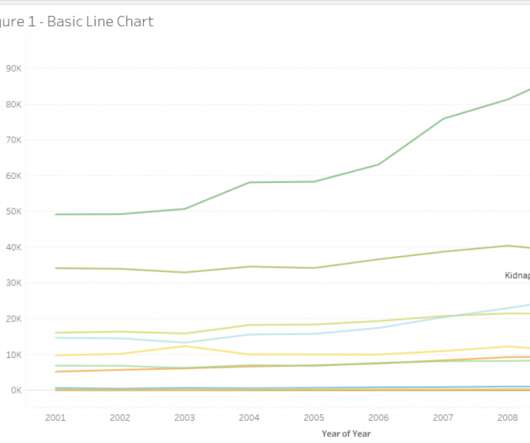
We can quickly tell that the crime rates for Cruelty by Husband and Relatives increased significantly from 2008 to 2009 compared to others. Related blogs by Techcanvass. It shows the totals as well as the relative size of the crimes with respect to others. Figure 2 – Base Line Chart.