Remove 2009 Remove 2020 Remove Data Visualization
article thumbnail

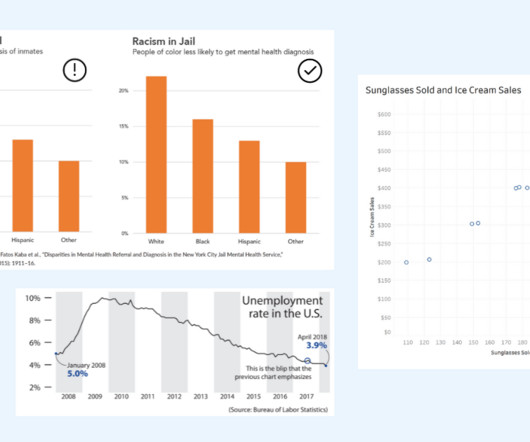
How to Spot Misleading Charts, a Checklist

Tableau

Alberto Cairo, data visualization expert and author of How Charts Lie Whether you are reading a social post, news article or business report, it’s important to know and evaluate the source of the data and charts that you view. Data Visualization expert and author Kathy Rowell says that we should always ask “Compared to What?”,

article thumbnail

How The Cloud Made ‘Data-Driven Culture’ Possible | Part 1

BizAcuity

14 years later, in 2020, the pandemic demands for remote work, and overnight revisions to business strategy. 2007: Amazon launches SimpleDB, a non-relational (NoSQL) database that allows businesses to cheaply process vast amounts of data with minimal effort. It took 2-3 years for another player to enter this market. Billion.

IBM cost 130
Insiders

Sign Up for our Newsletter

This site is protected by reCAPTCHA and the Google Privacy Policy and Terms of Service apply.

article thumbnail

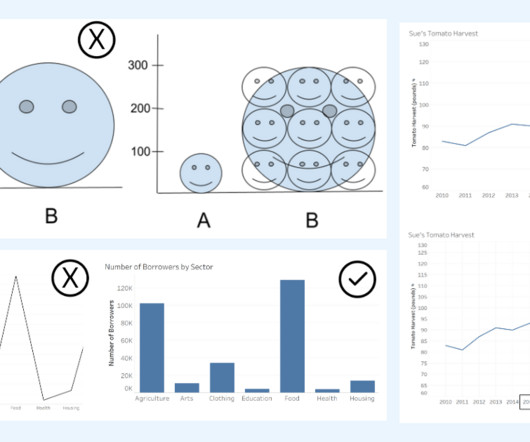
How To Spot Misleading Charts: Review the Message

Tableau

The key is to think critically and take time to evaluate the interpretations of data portrayed in charts. Data Visualization expert and author Kathy Rowell says that we should always ask “Compared to What?” Unemployment rate shown over multiple years, showing a downward overall trend from 2009 to 2018.

article thumbnail

Analyzing the history of Tableau innovation

Tableau

Working with multiple tables got a significant boost with cross data source actions in v5.0 (May April 2018), which focused on users who do understand joins and curating federated data sources. Visual encoding, in particular, tapped the power of the human visual system. Relationships in Tableau 2020.2 (May

article thumbnail

Why companies must close the data literacy divide

Domo

Similarly, all of the rich data visualizations and intelligence built into today’s self-service analytics tools can be negated by a simple deficiency in data literacy, which can be defined as the ability to understand, use and communicate data effectively. How valuable would it be to someone who is illiterate?

article thumbnail

Misleading Statistics Examples – Discover The Potential For Misuse of Statistics & Data In The Digital Age

Data Pine

A 2009 investigative survey by Dr. Daniele Fanelli from The University of Edinburgh found that 33.7% of scientists surveyed admitted to questionable research practices, including modifying results to improve outcomes, subjective data interpretation, withholding analytical details, and dropping observations because of gut feelings….

Digital 145